

November 21, 2017
AdWords x Data Studio: 2 Powerful Graphs
Get running with AdWords and Data Studio with the insights from the following two graphs.
If you feel the ease of working with Google’s long standing tools such as the Tag Manager, Analytics, and maybe AdWords, chances are high you’ve also fallen in love with the Data Studio in the meanwhile. Especially the duo AdWords and Data Studio makes a very good team.
From time to time, though, you may wonder: Okay now what is it really good for, like, is there something really new I can derive from using both tools in conjunction besides the same old AdWords tables being displayed in a beautiful manner? Sure, the value stemming from Data Studio’s heatmap capabilities alone shouldn’t be underestimated. Nonetheless, there is more. Get inspired.
Monitor Quality Score over time
Maybe you’ve previously used a mix of AdWords Scripts and Google Sheets to stay in touch with the evolving Quality Scores of your accounts. Since the advent of Data Studio, though, there is a much more straight-forward approach that shouldn’t be missing from your dashboard.
There are just a few steps required to generate an impressive charts that allows for getting a sense of how your account’s impressions are distributed along Quality Scores.
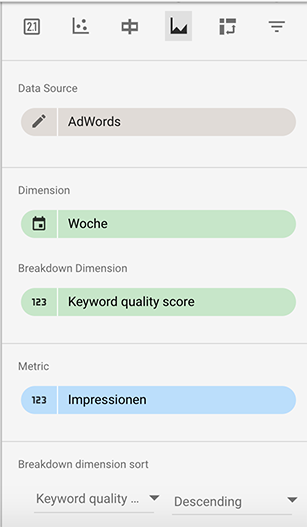
- Create a new area chart.
- Pick your AdWords account as a data source.
- Choose *Week *as time dimension.
- Choose Keyword quality score (Yes it’s labelled like that even in non-english accounts) as breakdown dimension.
- Select *Impressions *as your metric.
- Sort by Quality Score descending.
- Select a 100% stack view.
- Adjust look and feel.
Afterwards, lean back and enjoy this stunning view (Actually the dip in quality score 10 impression share is not that stunning at all):
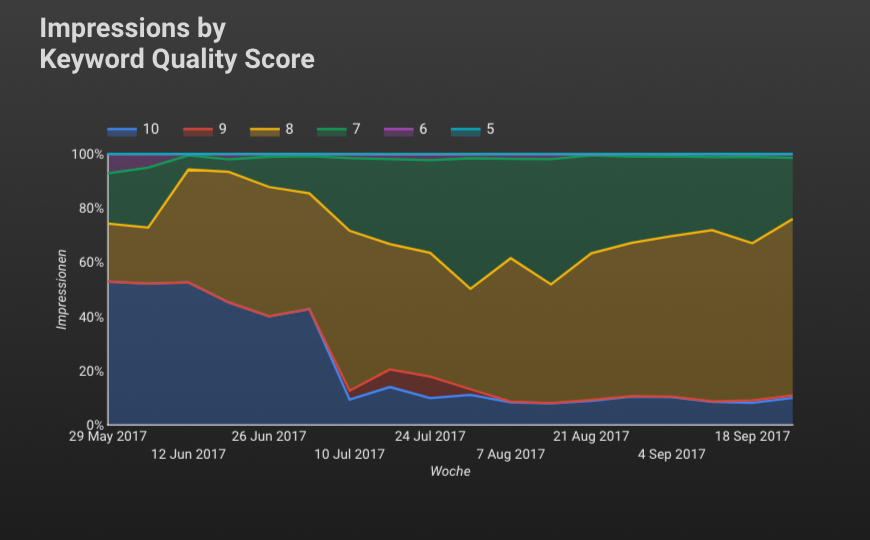
This graph tells us that while in May 50% of our impressions were of quality score 10, this very share fell to a mere 15% in September…
Monitor queries served independent of account structure
Sometimes it can be useful, especially with regard to an account audit, to understand how actual search queries perform over time, no matter how the underlying account structure evolves. Imagine the following example: In a given account, the search traffic stemming from “hotel booking berlin” in 2016 is served by the keyword +hotel +booking in campaign A, adgroup B. Then, after some account improvements, 2017 sees the traffic coming in through the keyword [hotel booking berlin] in campaign C, adgroup D. Further imagine you’re not the primary manager and you’re not familiar with what is going on. Or you‘re the manager but you want to be sure not to slowly lose performance due to account modifications. Now consider the following Data Studio table to overcome this blindness.
- Create a table.
- Choose the metrics you’re interested in such as impressions, clicks, costs, etc.
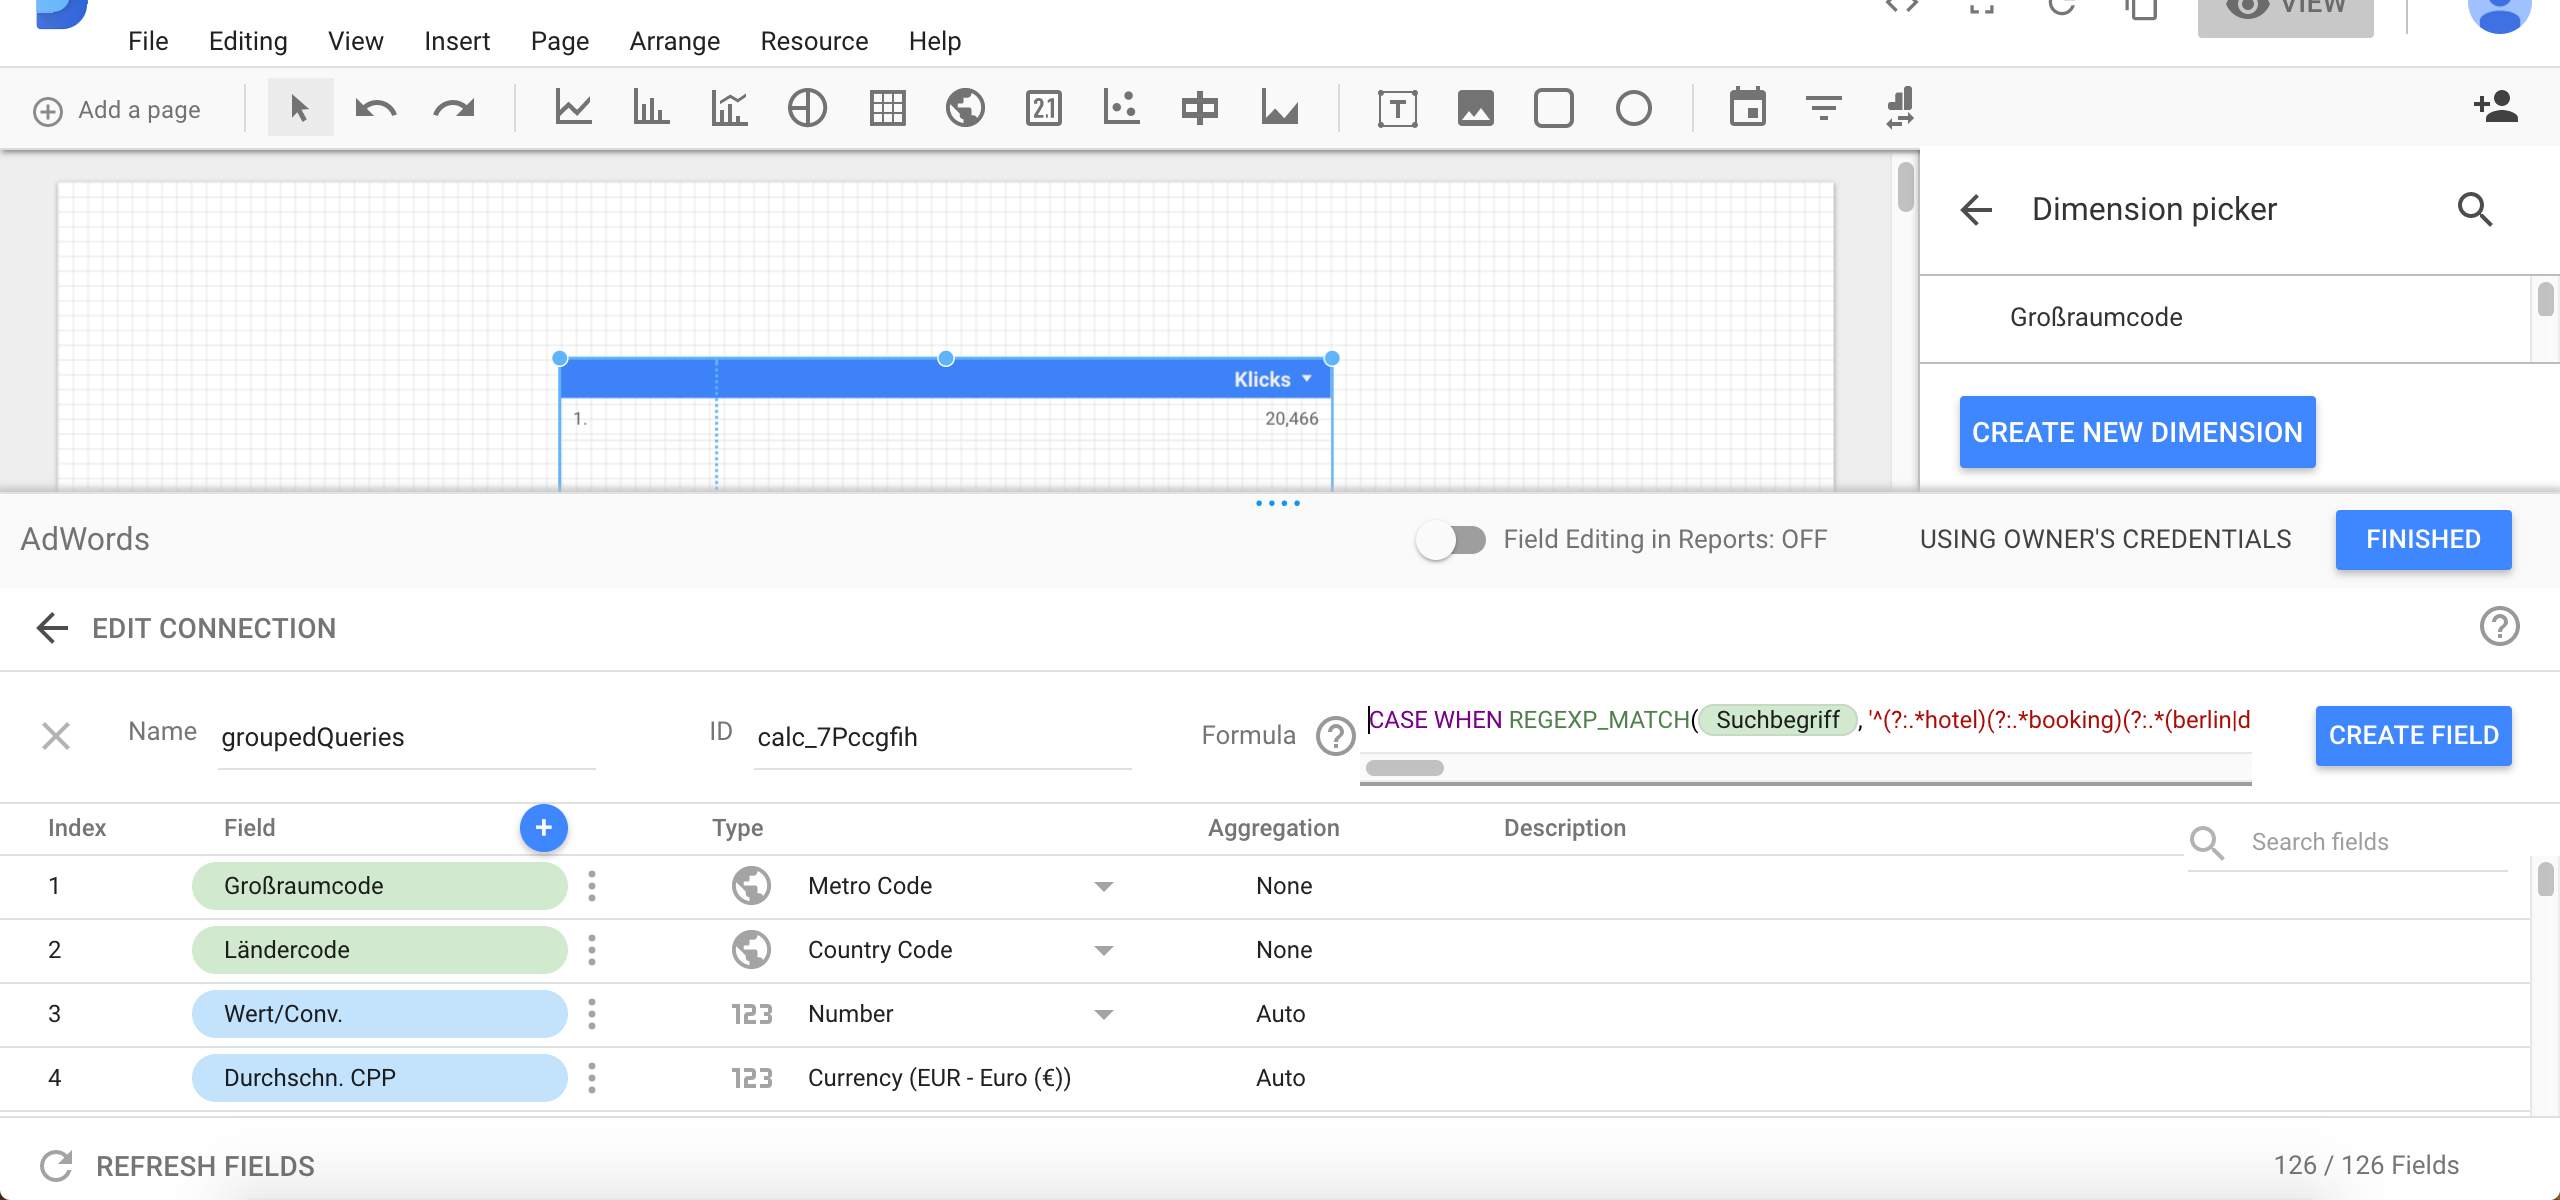
- Edit your AdWords data source and add a new field, in the screenshot it’s labelled groupedQueries.
- Then you have to build a formula for this field, including regular expressions, depending on what traffic slices are interesting to you. For instance, you could apply the following logic:
    CASE
    WHEN REGEXP_MATCH(*{search term}*, ‘^(?:.*hotel)(?:.*booking)(?:.*berlin|dublin).*$’ THEN ‘Hotel* Booking* Berlin|Dublin*'*
    *WHEN REGEXP_MATCH(*{search term}*, ‘^(?:.*hotel)(?:.*booking).*$’ THEN ‘Hotel* Booking*'
    WHEN REGEXP_MATCH(*{search term}*, ‘^(?:.*hotel).*$’ THEN ‘Hotel*'
    END
A block like *(?:.*hotel) *tells the interpreter that we are looking for the mentioned word. In line, *(?:.*hotel)(?:.booking) is the code for looking up queries that contain hotel AND booking. One step further, we add another mandatory component, but this can be Berlin OR Dublin as noted by *(?:.berlin|dublin).
Proceeding like this, you have to work your way down from long to short tail as the CASE WHEN expression triggers on the first match and, indeed, all regular expressions above yield positive for the search term “hotel booking berlin”. However, for our reporting requirements, we want this particular query to be counted in the first bucket.
- Add the created *groupedQueries *field as dimension to your table and, for instance, month as time dimension.
After applying some style customizations we end up with the following table:
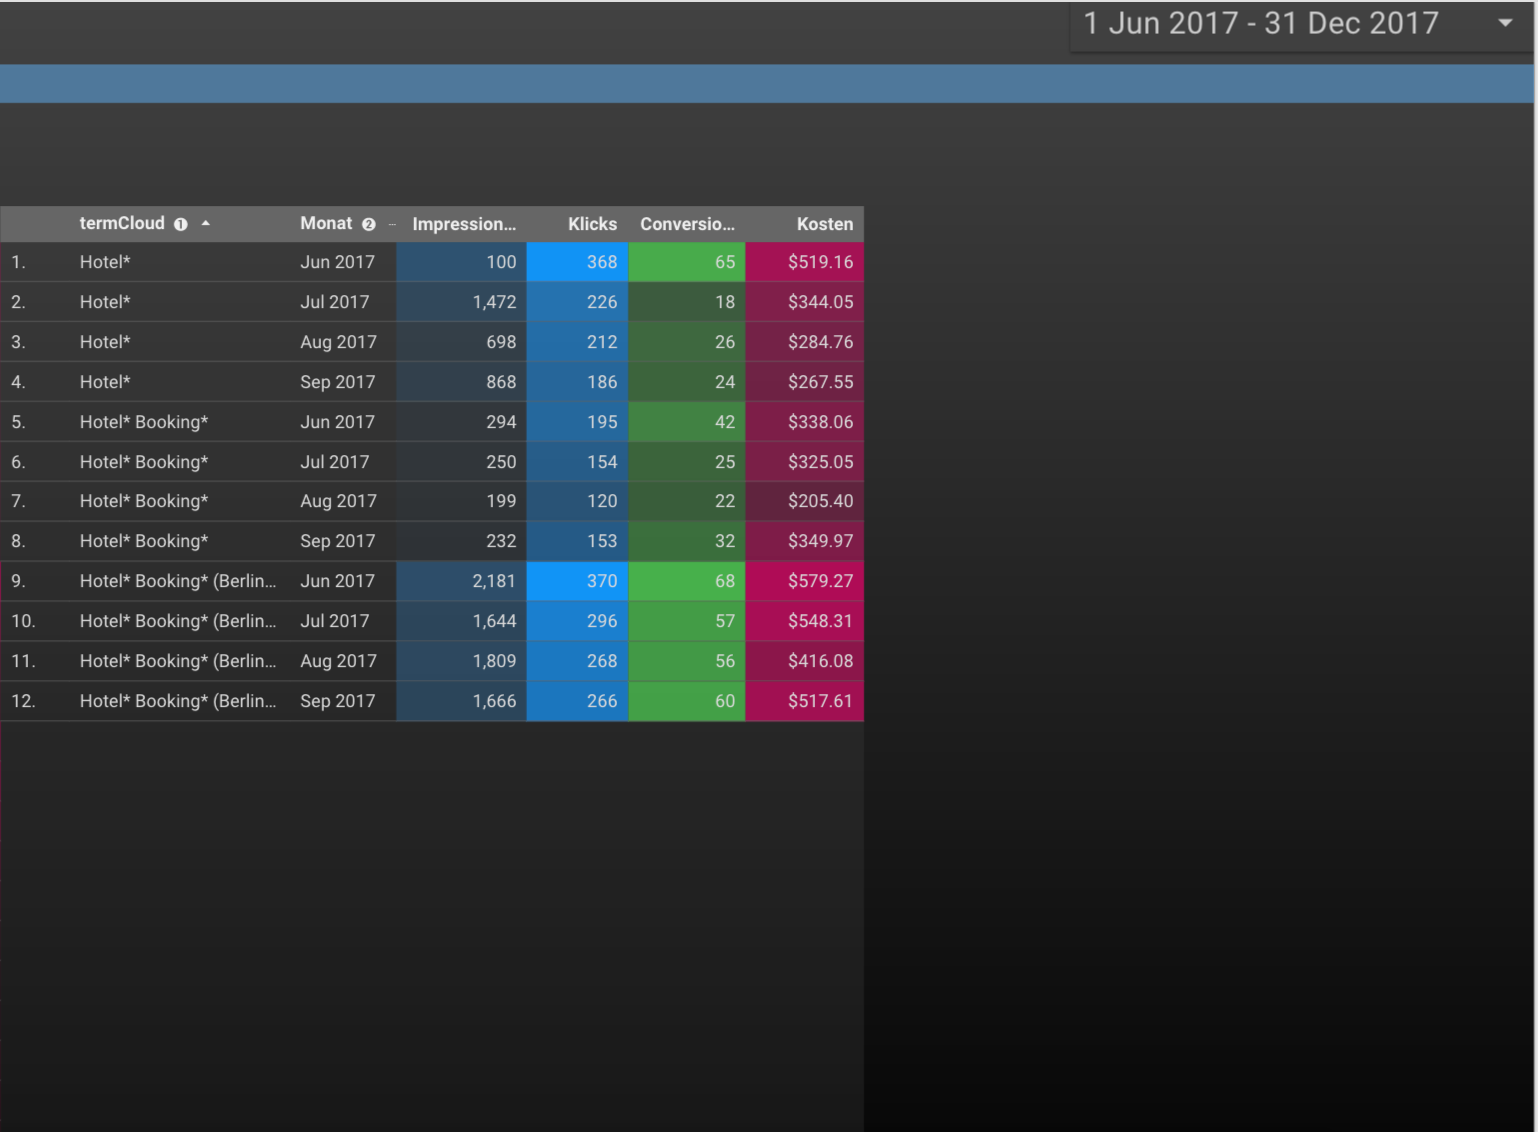
This table tells us a lot about our account. Irrespective of changes in keywords, adgroups, campaigns, etc., we can see how short tail traffic, that is all search queries containing the words hotel, booking, and berlin or dublin, as well as long tail traffic evolves over time. Further, we separate long tail traffic between, on the one hand, all queries containing at least hotel and booking and, on the other hand, the remaining generic traffic where the only condition is the word hotel to be included in the search term.